The calibration information shows how well calibrated this lens is likely to be new, out of the box. A higher score (close to 100) indicates that you are less likely to need to calibrate the lens. The score takes into account the likely amount of calibration required, the variation in calibration across many lenses as well as the likely improvement between an uncalibrated and calibrated lens. For zoom lenses, we also use parfocality, which is a measure of the difference in calibration required between each end of the zoom range.
Summary
The summary information shows the metrics measured to build the score.
| 500mm |
|---|
| Typical Focus Adjustment Magnitude | 12.5 units |
| Focus Adjustment Variation | 11.1 units |
| Adjusted Focus Quality Improvement | 32.7% |
| Requiring No Adjustment | 0.0% |
| Requiring Visually Significant Adjustment (4 or more units) | 100.0% |
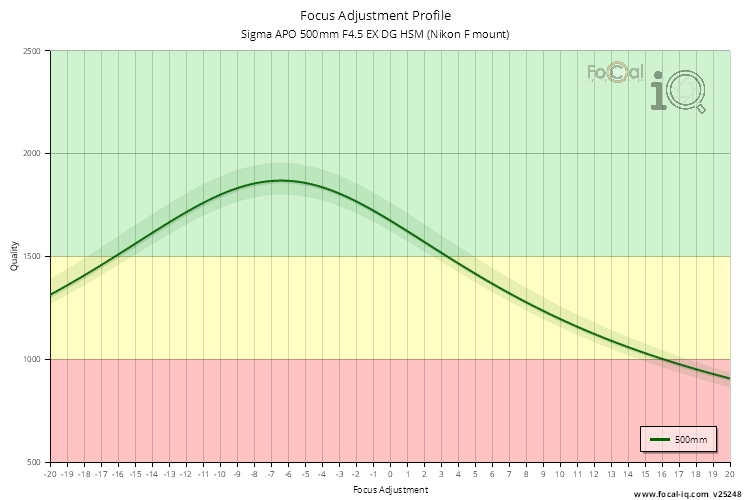
Focus Adjustment Profile
The curve is the composite quality levels across all copies of this lens.
| 500mm |
|---|
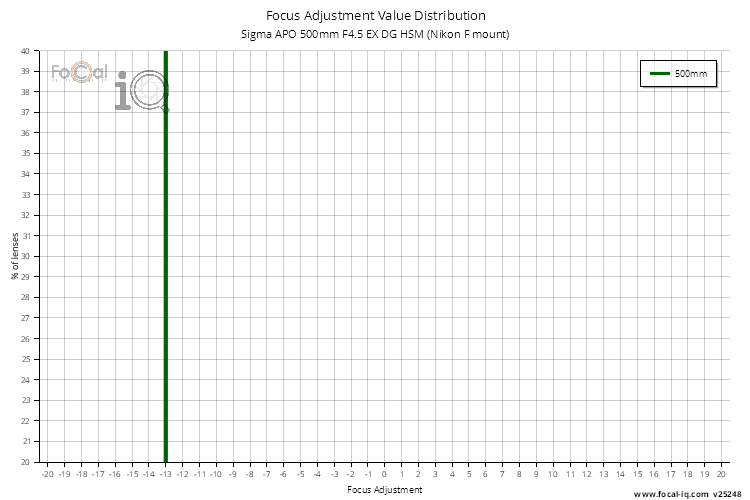
| Typical Focus Adjustment Value | -6.3 units |
| Adjusted Focus Quality Improvement | 32.7% |
Focus Adjustment Value Distribution
The bar height indicates the percentage of camera/lens combinations that resulted in the specified focus adjustment value.
| 500mm |
|---|
| Focus Adjustment Variation | 11.1 units |
| Requiring No Adjustment | 0.0% |
| Requiring Minimal Adjustment (no more than 1 unit) | 0.0% |
| Requiring Visually Noticeable Adjustment (2-3 units) | 0.0% |
| Requiring Visually Significant Adjustment (4 or more units) | 100.0% |
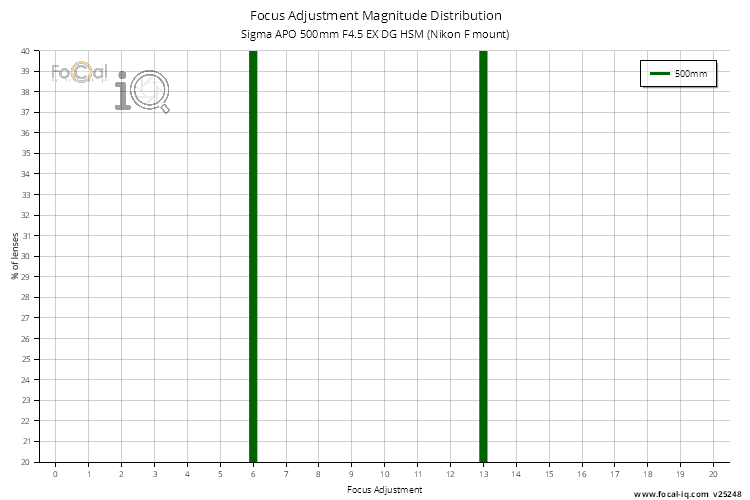
Focus Adjustment Magnitude Distribution
The bar height indicates the percentage of camera/lens combinations that resulted in the specified Focus Adjustment Magnitude. This is the size of the focus adjustment needed to calibrate the lens, ignoring the direction.
| 500mm |
|---|
| Typical Focus Adjustment Magnitude | 12.5 units |
The focus information shows how consistent and accurate the focus is for this lens, measured across all camera bodies.
Summary
The summary information shows the metrics measured to build the score.
| 500mm |
|---|
| Calibrated Focus Error | 1.4 units |
Focus Consistency
The gauge(s) below show the average amount of error from perfect focus for this lens across all camera bodies. The value is expressed as focus adjustment units (i.e. AF Microadjustment units for Canon cameras, AF Fine Tune units for Nikon, Sony etc). The lower the value, the better the focus repeatability on this lens.
500mm
Focus Shift
The focus shift information shows how the point of best focus changes across the aperture range.
Wide Performance Score 500mm | |
The wide information shows the performance of the lens when wide open. The measurements are comparisons with the values at the aperture of best image quality, and include measurements of quality, astigmatism and colour-specific quality.
Summary
The summary information shows the metrics measured to build the score.
| 500mm |
|---|
| Aperture Stops (Wide to Peak) | 0.0 |
| Wide Quality Change (vs best IQ) | -17.6% |
| Astigmatism (wide) | 3.8% |
| Wide Astigmatism Change (vs best IQ) | +0.5% |
| Red Quality (wide) | 99.4% |
| Wide Red Quality Change (vs best IQ) | +0.1% |
| Blue Quality (wide) | 97.6% |
| Wide Blue Quality Change (vs best IQ) | 0.0% |
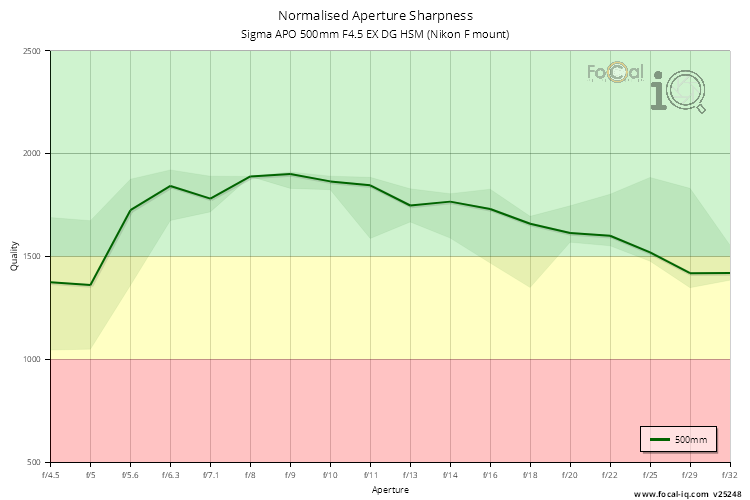
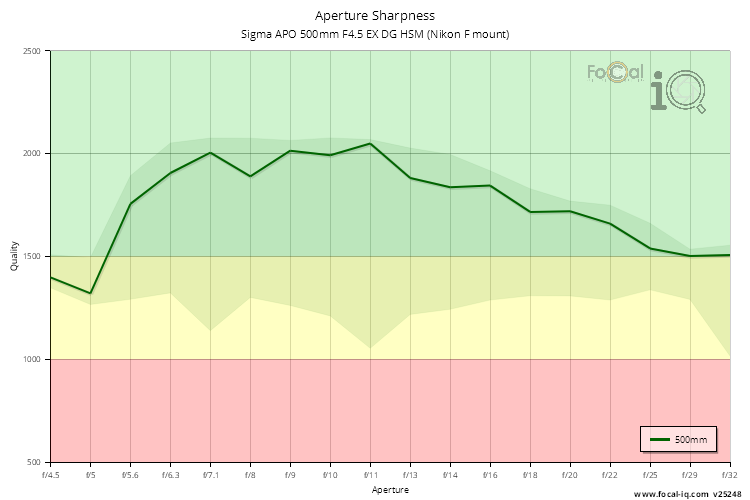
Aperture Sharpness Profile
| 500mm |
|---|
| Wide Quality Change (vs best IQ) | -17.6% |
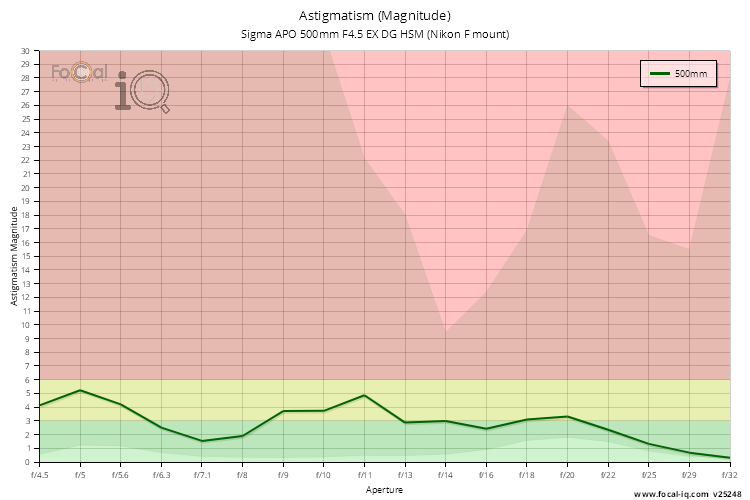
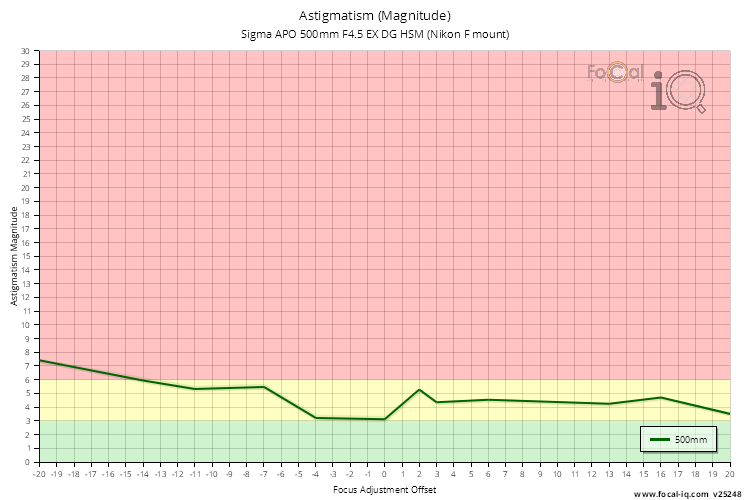
Astigmatism
| 500mm |
|---|
| Astigmatism (wide) | 3.8% |
| Astigmatism (at best IQ) | 3.3% |
| Wide Astigmatism Change (vs best IQ) | +0.5% |
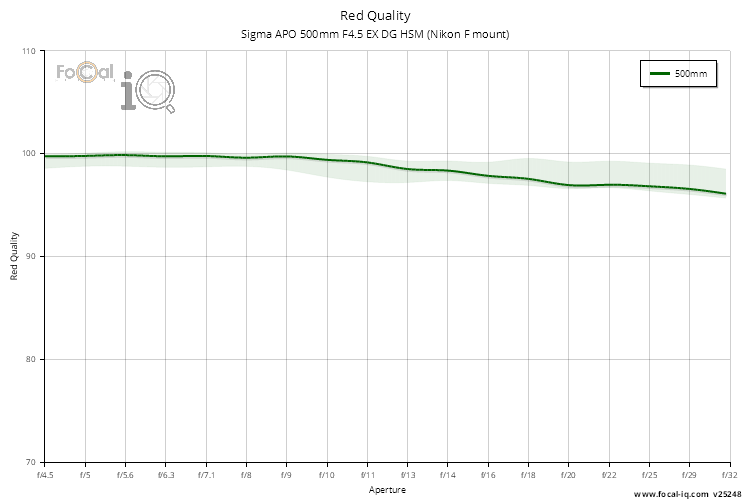
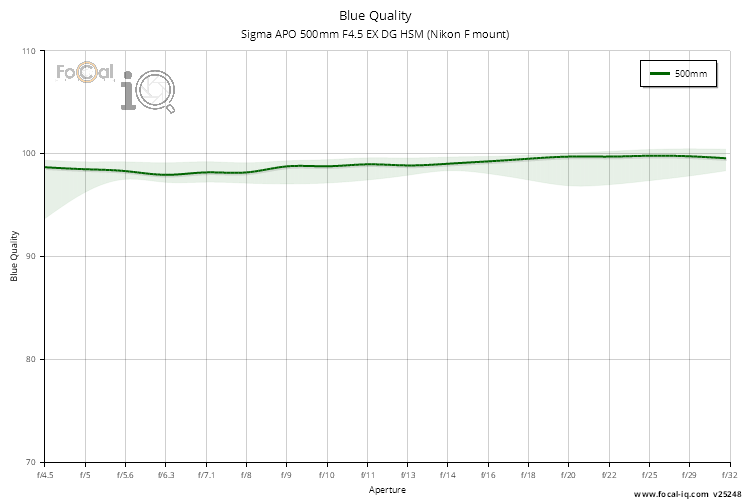
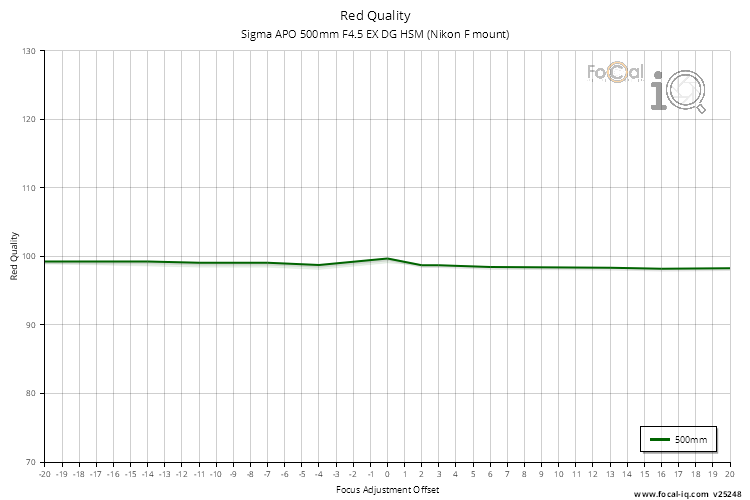
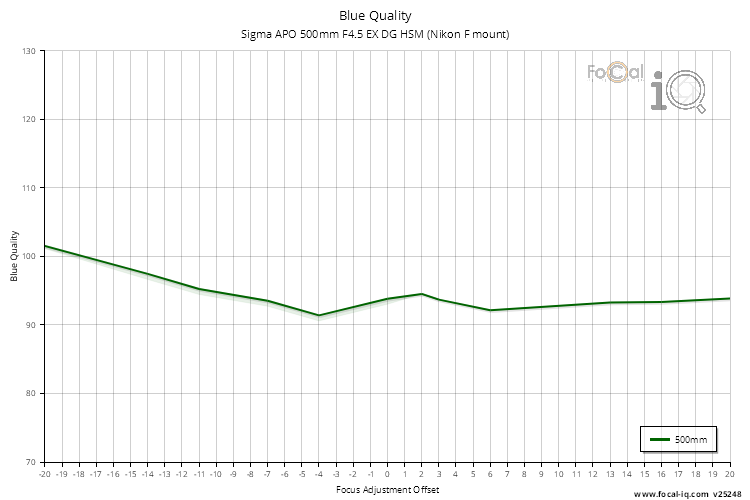
Red/Blue Quality
| 500mm |
|---|
| Red Quality (wide) | 99.4% |
| Red Quality (at best IQ) | 99.3% |
| Wide Red Quality Change (vs best IQ) | +0.1% |
| 500mm |
|---|
| Blue Quality (wide) | 97.6% |
| Blue Quality (at best IQ) | 97.6% |
| Wide Blue Quality Change (vs best IQ) | 0.0% |
Peak Performance Score 500mm | |
The peak information shows the performance of the lens at the aperture of best image quality.
Summary
The summary information shows the metrics measured to build the score.
| 500mm |
|---|
| Aperture Stops (Wide to Peak) | 0.0 |
| High Quality Apertures (to f/8) | 1 of 6 (17%) |
| Astigmatism (at best IQ) | 3.3% |
| Red Quality (at best IQ) | 99.3% |
| Blue Quality (at best IQ) | 97.6% |
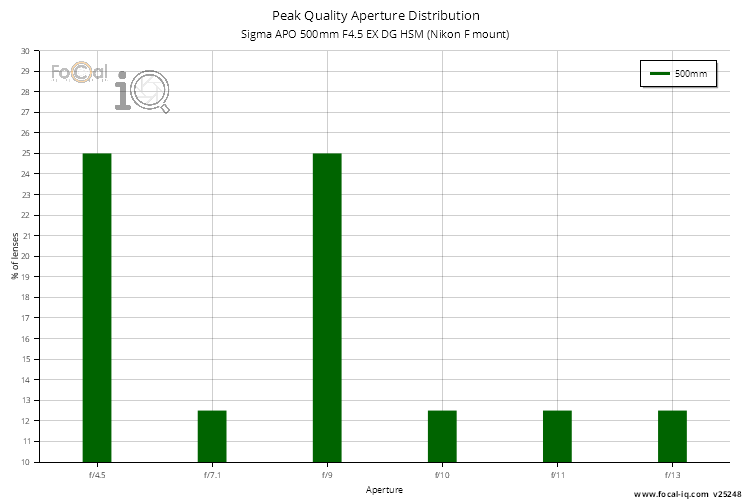
Peak Histo
| 500mm |
|---|
| Peak Aperture Range | f/5.4 to f/11.5 |
| Typical Peak Aperture | f/4.5 |
Aperture Sharpness Profile
| 500mm |
|---|
| Aperture at Peak Quality | f/9 |
| Peak Ouality Variation | 35.8% |
| High Quality Apertures (to f/8) | 1 of 6 (17%) |
Astigmatism
| 500mm |
|---|
| Astigmatism (at best IQ) | 3.3% |
Red/Blue Quality
| 500mm |
|---|
| Red Quality (at best IQ) | 99.3% |
| 500mm |
|---|
| Blue Quality (at best IQ) | 97.6% |
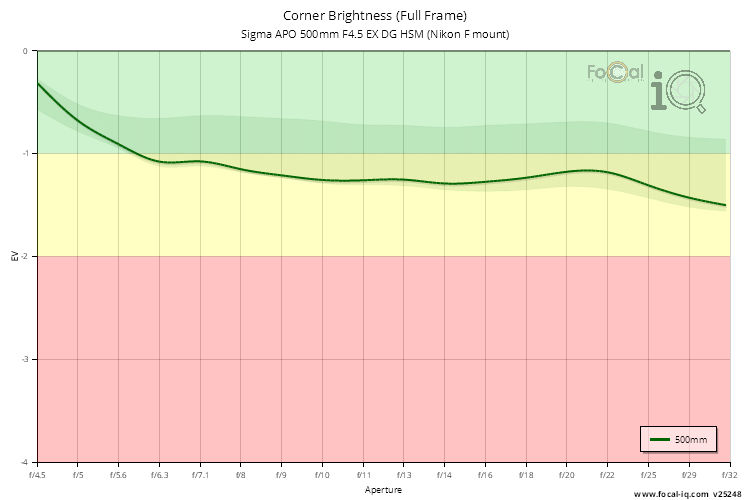
The vignetting information shows how the light is attenuated in the corners of the frame across the aperture range.
Summary
The summary information shows the metrics measured to build the score.
Full Frame
| 500mm |
|---|
| Vignetting | 0.0 EV |
| Affected Stop Count | 0.0 |
Corner Brightness Profile
The aberrations information shows details of the astigmatism and colour quality changes across the aperture and focus range.
Summary
The summary information shows the metrics measured to build the score.
| 500mm |
|---|
| Wide Aperture | f/4.5 |
| Aperture at Peak Quality | f/9 |
| 500mm |
|---|
| Astigmatism (at best IQ) | 3.3% |
| Astigmatism (wide) | 3.8% |
| Wide Astigmatism Change (vs best IQ) | +0.5% |
| Median Astigmatism | 2.2% |
| 500mm |
|---|
| Red Quality (at best IQ) | 99.3% |
| Red Quality (wide) | 99.4% |
| Wide Red Quality Change (vs best IQ) | +0.1% |
| Median Red Quality | 98.9% |
| 500mm |
|---|
| Blue Quality (at best IQ) | 97.6% |
| Blue Quality (wide) | 97.6% |
| Wide Blue Quality Change (vs best IQ) | 0.0% |
| Median Blue Quality | 99.0% |
Quality
| 500mm |
|---|
| Wide Aperture | f/4.5 |
| Aperture at Peak Quality | f/9 |
Astigmatism
| 500mm |
|---|
| Astigmatism (wide) | 3.8% |
| 500mm |
|---|
| Astigmatism (at best IQ) | 3.3% |
| Astigmatism (wide) | 3.8% |
| Wide Astigmatism Change (vs best IQ) | +0.5% |
| Median Astigmatism | 2.2% |
Red
| 500mm |
|---|
| Red Quality (wide) | 99.4% |
| 500mm |
|---|
| Red Quality (at best IQ) | 99.3% |
| Red Quality (wide) | 99.4% |
| Wide Red Quality Change (vs best IQ) | +0.1% |
| Median Red Quality | 98.9% |
Blue
| 500mm |
|---|
| Blue Quality (wide) | 97.6% |
| 500mm |
|---|
| Blue Quality (at best IQ) | 97.6% |
| Blue Quality (wide) | 97.6% |
| Wide Blue Quality Change (vs best IQ) | 0.0% |
| Median Blue Quality | 99.0% |
Prduction Quality Score 500mm | |
The physical quality information combines consistency and quality metrics to indicate the overall physical (electrical, mechanical and optical) quality and consistency of the lens.
Summary
The summary information shows the metrics measured to build the score.
| 500mm |
|---|
| Typical Focus Adjustment Magnitude | 12.5 units |
| Requiring Visually Significant Adjustment (4 or more units) | 100.0% |
| Focus Adjustment Variation | 11.1 units |
| Calibration Quality Variation | 8.9% |
| Peak Ouality Variation | 35.8% |
| Aperture Change Image Motion | 11.7 μm |
| Focus Change Image Motion | 88.8 μm |
Focus Adjustment Profile
| 500mm |
|---|
| Calibration Quality Variation | 8.9% |
Focus Adjustment Magnitude Distribution
| 500mm |
|---|
| Typical Focus Adjustment Magnitude | 12.5 units |
| Focus Adjustment Variation | 11.1 units |
Aperture Sharpness Profile
| 500mm |
|---|
| Peak Ouality Variation | 35.8% |
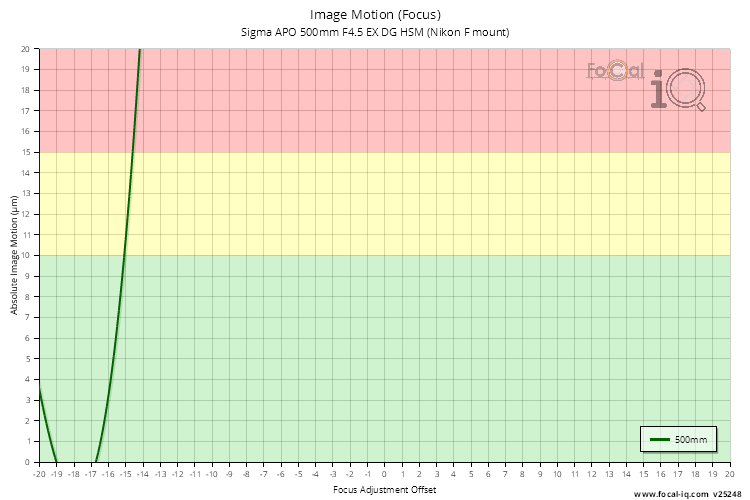
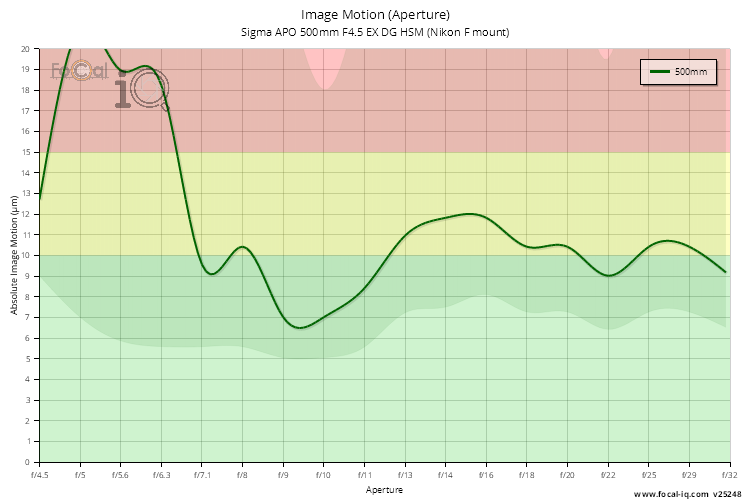
Image Motion
| 500mm |
|---|
| Focus Change Image Motion | 88.8 μm |
| 500mm |
|---|
| Aperture Change Image Motion | 11.7 μm |
Spotted an error or have feedback about the site? Contact us